
Bedroom count
Property type
Last updated on December 13, 2025
Average rent in
Holbrook, MA
Last updated on December 13, 2025
Last updated on December 13, 2025
Bedroom count
Property type
As of December 2025, the median rent for all bedroom counts and property types in Holbrook, MA is $2,359. This is +24%, or $459, higher than the national average.
average price per square foot
Median rent
$2,359
Total rentals
16
for rent on Zumper.com
As of December 2025, the median rent for all bedroom counts and property types in Holbrook, MA is $2,359. This is +24%, or $459, higher than the national average.
average price per square foot
Rent ranges
Households
Median rent and rent ranges are based on Zumper inventory in the last 30 days. Household data are provided by the US Census Bureau.
Rent price trends in
Holbrook, MA
Rent price trends
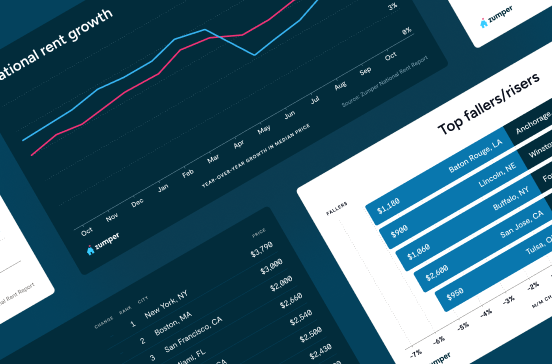
Rent prices for all bedroom counts and property types in Holbrook, MA have remained the same in the last month and have decreased by 6% in the last year.
Rent prices on this page are calculated on a rolling 30-day basis and updated daily.
Rent comparables in
Holbrook, MA
The monthly rent for an apartment in Holbrook, MA is $2,200. A 1-bedroom apartment in Holbrook, MA costs about $1,973 on average, while a 2-bedroom apartment is $2,359. Houses for rent in Holbrook, MA are more expensive, with an average monthly cost of $2,800.
Comparables | ||||
|---|---|---|---|---|
1 bedroom | $1,958 |  4% | 11% | |
2 bedroom | $2,400 |  36% | 13% | |
3 bedroom | $3,000 | No Change | 14% | |
4 bedroom | $3,400 | No Change | - | |
Studio | $1,350 | No Change | - |
At this time, we don't have enough active inventory for all rentals to generate data. Please check back soon to see neighborhood rent prices in Holbrook, MA.
Comparables | ||||
|---|---|---|---|---|
Apartments | $2,200 | 3% | No Change | |
Condos | $2,450 | No Change | No Change | |
Houses | $2,800 | 74% | No Change | |
Rooms | $2,160 | - | - |
Studio
Average rent
$1,350
1 bedroom
Average rent
$1,958
Last 30 days
4%
Last year
11%
2 bedroom
Average rent
$2,400
Last 30 days
36%
Last year
13%
3 bedroom
Average rent
$3,000
Last year
14%
4 bedroom
Average rent
$3,400
At this time, we don't have enough active inventory for all rentals to generate data. Please check back soon to see neighborhood rent prices in Holbrook, MA.
Apartments
Average rent
$2,200
Last 30 days
3%
Condos
Average rent
$2,450
Houses
Average rent
$2,800
Last 30 days
74%
Rooms
Average rent
$2,160
The table above reflects average rent prices in Holbrook, MA, broken down by the number of bedrooms, neighborhoods, and property types. The availability of data for each category is dependent on market inventory and will adjust depending on your selected filters.
Compare rent prices in Holbrook, MA to other cities
Median rent prices in Holbrook, MA for all bedroom counts and property types compared to Canton, MA.
Holbrook
higher than the national median
higher than the national median
Takeaway
The median rent for all rentals in Holbrook, MA is 15% lower than the median rent in Canton, MA.
More data insights and reports

Are you interested in licensing our current and historical rental real estate data, or do you have custom data requests? Contact datalicensing@zumper.com.
Average rent in
Nearby cities
Explore rent trends in other markets
Canton
$2,788
Last year
Dedham
$2,700
Last year
Hull
$2,800
Last year
Marshfield
$2,455
Last year
Middleborough
$1,700
Last year
Needham
$3,436
Last year
Norton
$2,204
Last year
Randolph
$2,763
Last year
Rockland
$2,500
Last year
Stoughton
$2,882
Last year
Weymouth Town
$2,463
Last year
Winthrop Town
$2,400
Last year
Discover rentals in Holbrook, MA

17h ago
101 Longmeadow Drive, Holbrook, MA 02343
1–2 beds
1 bath
$2,434–$2,664
The price shown is for a 12-month lease. Fees may apply.Apartment for rent

5d+ ago
House for rent in Holbrook
1058 South Franklin Street, Holbrook, MA 02343
2 beds
2 baths
$4,100
The price shown is for a 12-month lease. Fees may apply.House for rent
Available Dec 18
5d+ ago
House for rent in Holbrook
1058 South Franklin Street, Holbrook, MA 02343
2 beds
2 baths
$4,100
The price shown is for a 12-month lease. Fees may apply.House for rent
Available Dec 18
17h ago
101 Longmeadow Drive, Holbrook, MA 02343
1–2 beds
1 bath
$2,434–$2,664
The price shown is for a 12-month lease. Fees may apply.Apartment for rent

4d ago
Apartment for rent in Holbrook
16 Abington Avenue #1R, Holbrook, MA 02343
1 bed
1 bath
$1,725
The price shown is for a 12-month lease and includes base rent plus any required monthly fees listed by the property.Apartment for rent
Available Dec 1
4d ago
Apartment for rent in Holbrook
16 Abington Avenue #1R, Holbrook, MA 02343
1 bed
1 bath
$1,725
The price shown is for a 12-month lease and includes base rent plus any required monthly fees listed by the property.Apartment for rent
Available Dec 1