
Bedroom count
Property type
Last updated on December 14, 2025
Average rent in
East Gwillimbury, ON
Last updated on December 14, 2025
Last updated on December 14, 2025
Bedroom count
Property type
As of December 2025, the median rent for all bedroom counts and property types in East Gwillimbury, ON is $2,065. This is +9%, or $165, higher than the national average.
average price per square foot
Median rent
$2,065
Total rentals
14
for rent on Zumper.com
As of December 2025, the median rent for all bedroom counts and property types in East Gwillimbury, ON is $2,065. This is +9%, or $165, higher than the national average.
average price per square foot
Rent ranges
Households
At this time, we don't have information to generate a distribution. Please check back soon.
Median rent and rent ranges are based on Zumper inventory in the last 30 days. Household data are provided by the US Census Bureau.
This report has limited data.Due a shortage of data for this selected bedroom and/or property type in East Gwillimbury, ON, in the last 30 days, rent estimates may not represent the actual market.
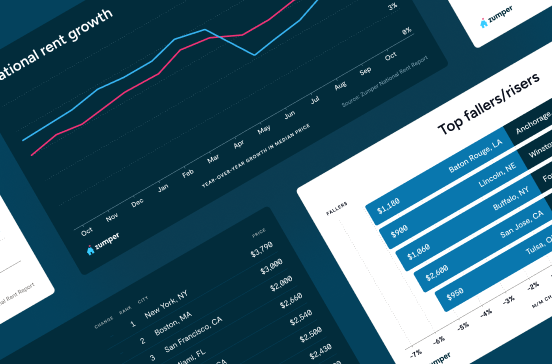
Rent price trends in
East Gwillimbury, ON
Rent price trends
Rent prices for all bedroom counts and property types in East Gwillimbury, ON have remained the same in the last month and have decreased by 26% in the last year.
Rent prices on this page are calculated on a rolling 30-day basis and updated daily.
Rent comparables in
East Gwillimbury, ON
The monthly rent for an apartment in East Gwillimbury, ON is $2,300. A 1-bedroom apartment in East Gwillimbury, ON costs about $1,999 on average, while a 2-bedroom apartment is $2,475. Houses for rent in East Gwillimbury, ON are more expensive, with an average monthly cost of $2,447.
Comparables | ||||
|---|---|---|---|---|
1 bedroom | $1,625 | No Change |  49% | |
2 bedroom | $2,299 |  3% | 1% | |
3 bedroom | $2,900 | 1% | 17% | |
4 bedroom | $3,500 | 30% | 34% | |
Studio | $1,630 | - | - |
Comparables | ||
|---|---|---|
Holland Landing | $2,049 |
Comparables | ||||
|---|---|---|---|---|
Apartments | $2,300 | No Change | No Change | |
Condos | $4,000 | - | - | |
Houses | $2,447 | 27% | No Change | |
Rooms | $1,630 | No Change | No Change |
Studio
Average rent
$1,630
1 bedroom
Average rent
$1,625
Last year
49%
2 bedroom
Average rent
$2,299
Last 30 days
3%
Last year
1%
3 bedroom
Average rent
$2,900
Last 30 days
1%
Last year
17%
4 bedroom
Average rent
$3,500
Last 30 days
30%
Last year
34%
Holland Landing
Average rent
$2,049
Apartments
Average rent
$2,300
Condos
Average rent
$4,000
Houses
Average rent
$2,447
Last 30 days
27%
Rooms
Average rent
$1,630
The table above reflects average rent prices in East Gwillimbury, ON, broken down by the number of bedrooms, neighborhoods, and property types. The availability of data for each category is dependent on market inventory and will adjust depending on your selected filters.
Compare rent prices in East Gwillimbury, ON to other cities
Median rent prices in East Gwillimbury, ON for all bedroom counts and property types compared to Aurora, ON.
East Gwillimbury
higher than the national median
higher than the national median
Takeaway
The median rent for all rentals in East Gwillimbury, ON is 14% lower than the median rent in Aurora, ON.
More data insights and reports

Are you interested in licensing our current and historical rental real estate data, or do you have custom data requests? Contact datalicensing@zumper.com.
Average rent in
Nearby cities
Explore rent trends in other markets
Aurora
$2,399
Last year
Barrie
$2,000
Last year
Bradford West Gwillimbury
$2,100
Last year
Brock
$1,997
Last year
Essa
$1,999
Last year
Georgina
$2,295
Last year
Innisfil
$2,000
Last year
King
$2,400
Last year
Newmarket
$2,171
Last year
New Tecumseth
$2,200
Last year
Springwater
$2,100
Last year
Whitchurch Stouffville
$2,450
Last year
Discover rentals in East Gwillimbury, ON

5d+ ago
Holland Landing house for rent in East Gwillimbury
5 beds
6 baths
$6,500
House for rent
Available Nov 25